Blog Details

blog image

September 2025 Real Estate Market Insights- Calgary and area

Oct 3, 2025  
  • 0

Key Highlights

  • Sales: 1,720
  • New Listings: 3,782
  • Inventory: 6,916 (▲ 36% YoY, ▲ 17% above seasonal norms)
  • Sales-to-New-Listings Ratio: 45%
  • Months of Supply: 4 (highest since 2020)

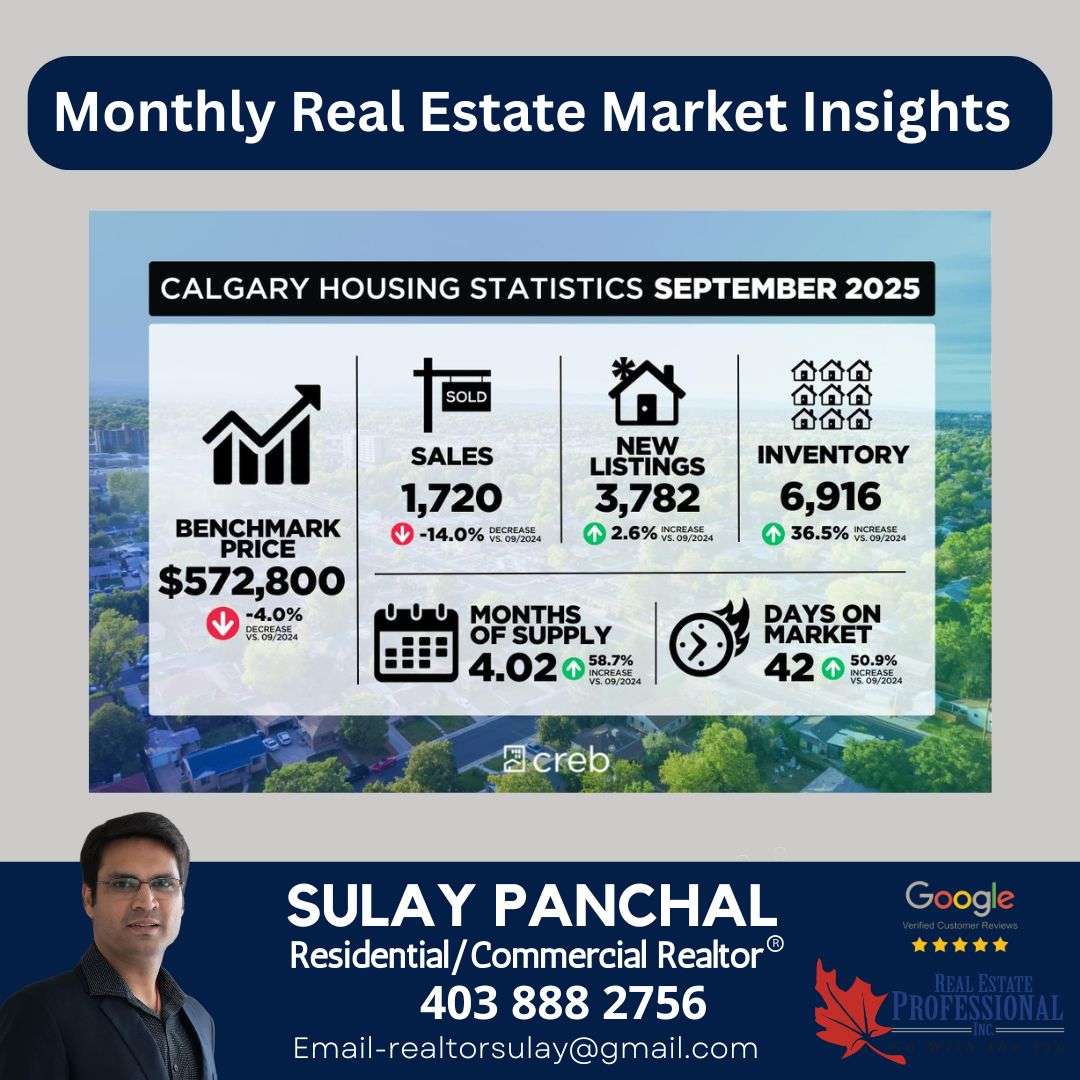
Trend: More supply + slower demand = a shift toward a more balanced or buyer-leaning market.


By Property Type

Detached Homes

  • Sales: 859 | New Listings: 1,905
  • Benchmark Price: $749,900
  • Change: ▼ 1% YoY | ▼ 1% MoM
  • Most stable segment, though NE & East districts saw the steepest declines (-6%).

Semi-Detached

  • Sales: 156 | New Listings: 361
  • Benchmark Price: $684,800
  • Change: ▲ 1% YoY
  • City Centre leads gains; inventory creeping up but prices remain steady.

Row Homes

  • Sales: 304 | New Listings: 592
  • Benchmark Price: $437,100
  • Change: ▼ 5% YoY
  • Highest September inventory since 2018; NE district hit hardest.

Apartment Condos

  • Sales: 401 | New Listings: 924
  • Benchmark Price: $322,900
  • Change: ▼ 6% YoY | ▼ 1% MoM
  • Weakest segment; supply at 5 months, first time since 2021.

Regional Spotlights

Airdrie

  • New Listings: 295 (record high)
  • Benchmark Price: $526,000
  • Change: ▼ 5% YoY

Cochrane

  • New Listings: 148 (record high)
  • Benchmark Price: $584,300
  • Change: ▲ 1% YoY

Okotoks

  • New Listings: 69 (down YoY)
  • Benchmark Price: $613,900
  • Change: ▼ 3% YoY

What This Means for You

  • Buyers: More choice, especially in condos and row homes. Negotiation power is improving.
  • Sellers: Detached and semi-detached remain resilient, but pricing strategically is critical as competition rises.
  • Investors: Watch for opportunities in softer condo and row segments while monitoring detached stability.

Stay Ahead of the Market

As supply and demand continue to shift this fall, understanding your specific market matters more than ever. Reach out for a tailored breakdown of your neighborhood or investment portfolio.

Click here to view the full City of Calgary monthly stats package.

Click here to view the full Calgary region monthly stats package.

Leave a Comment

Your email address will not be published. Required fields are marked *

Scroll to Top